Temperature affects the frequency of bell partials. As the temperature increases, partials get flatter. When very accurate tuning is required, for example for carillons, the effect of temperature needs to be taken into account. The variation in the partials with temperature is due both to changes in the physical dimensions of the bell, and in Young’s modulus (the elasticity) of bell metal.
The only published research I am aware of into the effect of temperature is a paper published by Arthur Jones in 1930 reporting on measurements at different temperatures of the hum, tierce and nominal of a single bell in the Dorothea Carlisle Chime at Smith College, Northampton, Massachusetts (ref 1). Jones measured that the frequency of bell partials on average falls by 2.91 cents per 10 deg C rise in temperature.
I have been conducting a similar experiment on the eleven bells at St Martin, Dorking, Surrey, measuring eight partials in each bell. Ten of these bells were cast by Taylors in 1998, and one by John Wilnar in 1642. Preliminary results from this experiment are that on average the partials fall by 2.678 ± 0.051 cents per 10 deg C. The John Wilnar bell shows a bigger variation of 3.08 cents per 10 deg C, well outside the confidence interval for the overall average. This may be due to a different metal composition. There may also be differences in the variation for different partials.
The current experiment has also highlighted unexpected difficulties in accurately measuring the higher partials in bells which need more investigation.
To explore these issues further, measurements at Dorking will continue as the ambient temperature continues to fall. This will both give a wider range of temperatures and increase the precision of the analysis. In addition, measurements will start on the eight bells at St Barnabas, Ranmore, Surrey, cast by Mears & Stainbank in 1859.
The preliminary conclusion of the recent investigation is that a peal of bells will remain almost exactly in tune with themselves and each other across large changes in temperature.
Arthur Jones’ measurements in 1929
The chime at Smith College was cast by Meneely of Troy in 1919. It has since been replaced with a Paccard carillon. A thermometer was hung near the bells and the partial frequencies measured on warm and cool days. The range of temperatures was from 0 deg C to just above 30 deg C. The frequencies were measured with three tuning forks that had been calibrated at temperatures near 0 deg C and 30 deg C. The frequencies measured were corrected for the temperature variation of the forks. It is not clear from Jones’ paper whether the thermometer and bells were open to the outside and therefore subject to wind and temperature differences between the thermometer and the bell.
Jones based his analysis on a formula Nt = N0 (1 – at) where Nt is the frequency of a partial at t deg C, N0 is the frequency at 0 deg C, and a is a constant. The hum of the bell under investigation had a doublet so four sets of measurements were taken at each temperature. The values of a derived from the experiment and the corresponding change in cents per 10 deg C are as follows:
| Partial | a | cents / 10 deg C |
|---|---|---|
| Nominal | 0.000174 | -3.015 |
| Tierce | 0.000168 | -2.911 |
| Hum 1 | 0.000163 | -2.824 |
| Hum 2 | 0.000166 | -2.876 |
| Average | 0.000168 | -2.911 |
The Dorking experiment
The ten ringing bells at Dorking are hung on one level in a cast-iron frame. The 1642 Wilnar bell hangs in a frame above the ringing peal. There is a roof above the bells at the base of the spire, and sound control that when shut isolates the bell chamber from the outside air and from breezes. The sound control is normally open and was closed for each set of measurements. A thermometer was hung on the frame at the level of the bells. This was enclosed in an open box to reduce the effect of drafts. The thermal mass of the thermometer is very much less than that of a bell so it will respond much more quickly to changes in air temperature.
Eight partials (hum, prime, tierce, quint, nominal, superquint, octave nominal and I7) were measured for each bell. The bells were gently chimed while being recorded on a mobile phone. The recordings were analysed with Wavanal. The mobile phone was calibrated each week against the NIST test tones and was always accurate to ± 0.01Hz. 21 sets of measurements were taken between 13 August 2026 and 7 November 2026 at temperatures between 8.7 deg C and 32.5 deg C, for a total of 1,848 frequency measurements. Each bell was sounded for at least 10s allowing frequency measurement to 0.1Hz.
All the bell partials have doublets and care was taken to always select the same half of the doublet pair for analysis. It had been hoped that because the bells were always chimed in an identical fashion, the same half of the doublet pair would always dominate. This proved not to be the case. More discussion of the problems measuring the upper partials is included in a later section.
Statistical analysis of the frequencies measured was done using software written to automate the calculations required. The deviation in cents was calculated from the frequency of each separate bell partial against the average for that bell partial across all temperatures, and linear regression done of the deviation in cents against temperature.
Dorking experiment results
The following chart shows the variation in cents plotted against air temperature. The red line is the regression line.
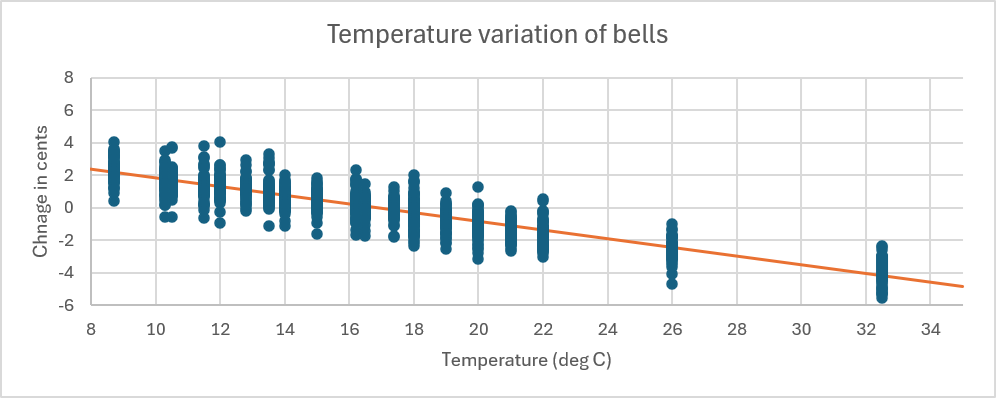
The spread of the points for each temperature is due to the difficulty in making precise repeated measurements of partial frequencies, discussed further below.
R2 for the 1,848 data points is 0.853, i.e. a moderately good correlation. A linear regression of partial variation in cents from the average, against temperature, gives a slope of -0.2678 with 95% points at either side of -0.2729 and -0.2628. The slope corresponds to a fall in cents of partial frequencies with increasing temperature of 2.678 ± 0.051 cents per 10 deg C. The experiment is not precise enough to suggest any relationship other than linear.
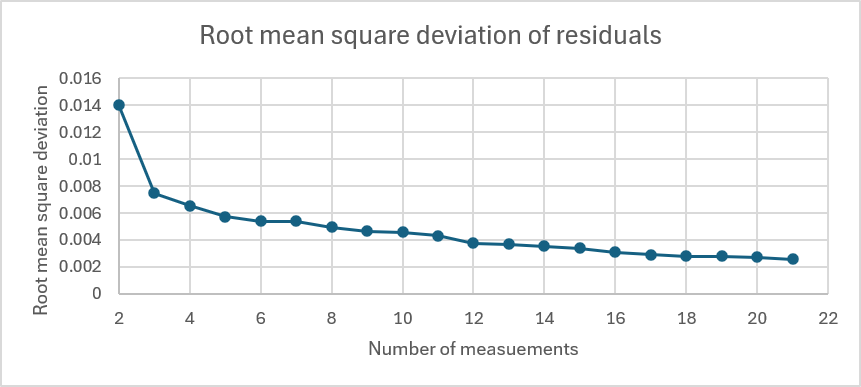
A plot of the root mean square deviation of residuals against number of measurements shows that continuing to take further measurements is gradually increasing the precision of the results:
Effect of temperature on individual partials
The following plot shows the effect of temperature on individual partials. The quantity plotted on the vertical axis is the regression slope, which is the change in cents for an increase of 1 deg C in temperature. The individual high and individual low lines either side of the individual average are the 95% confidence intervals.
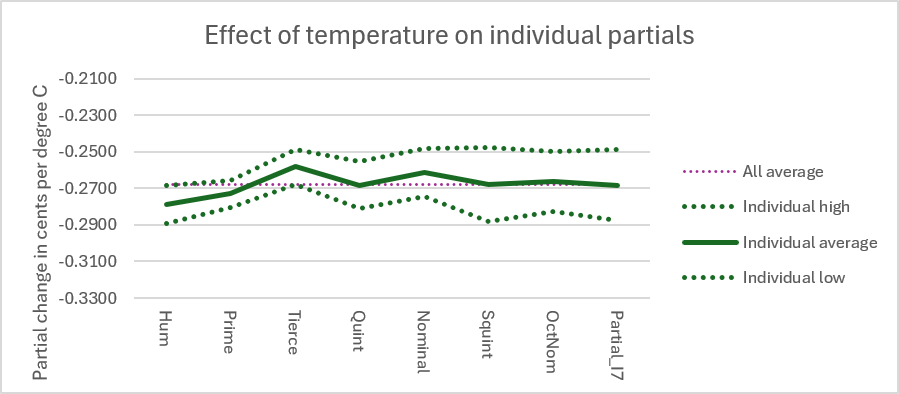
The average for all partials (the red dotted line) lies within the 95% confidence range for all the partials, so the different values for different individual partials are not statistically significant. What this means is that a bell will remain in tune with itself at different temperatures. However, there are differences between the partials, and these were also observed by Arthur Jones in 1929. As different partials are affected by different portions of the bell, one can speculate that when the bell expands as its temperature rises, different partials can be affected differently.
Effect of temperature on different bells
The following plot shows the effect of temperature on all the partials measured in an individual bell. As before, the quantity plotted on the vertical axis is the regression slope, which is the change in cents for an increase of 1 deg C in temperature, and the individual high and individual low lines either side of the individual average are the 95% confidence intervals.
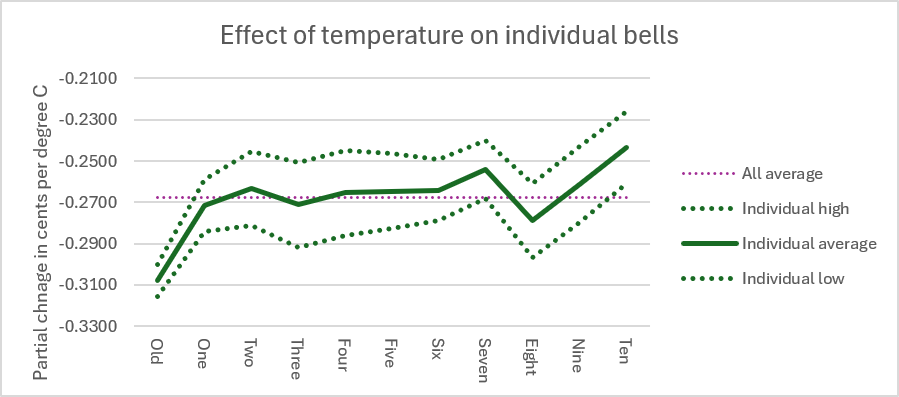
In this case the average for all bells does not sit within the 95% confidence range for some of the bells. The rate of change with temperature for the old bell is considerably greater than the average, and a t-test of the rate for the old bell against the average rate for all the others has a p-value which is essentially zero, so there is no doubt that this bell’s partials change differently with temperature.
Bells seven, eight and especially ten also have rates of change with temperature different from the average. Only that of bell ten is statistically significant at the 5% level.
These rates could be different because the bells are at different temperatures from that measured on the thermometer. The old bell in particular is hung above the others. However, these differences can be observed consistently in all sets of measurements. Measurements were taken both at the start of the day, when the air temperature would normally be rising, and at the end, when the temperature would normally be falling. So the hypothesis, to be tested with measurements on other bells, is that the differences are instead due to differences in the metal composition of the bells, which could affect changes with temperature of both dimensions and Young’s modulus in different bells.
These results suggest that when the temperature of a peal of bells changes, the bells will remain almost exactly in tune with one another. In the case of the peal of ten at Dorking, if the temperature changes from 0 deg C to 30 deg C then bell eight (the bell with the numerically largest rate of change) will flatten by 8.3 cents and bell ten (the bell with the numerically smallest rate of change) will flatten by 7.3 cents. The relative change between these two bells of 1 cent is negligible. If the old bell were still in the peal, the difference for this temperature swing between the old bell and bell ten is 1.93 cents which is also negligible.
Measuring partials
All the partials in all the bells investigated are split with a doublet. Doublets are caused by irregularities in the rotational symmetry of the bell. This is the spectrum of the tierce of bell 3:
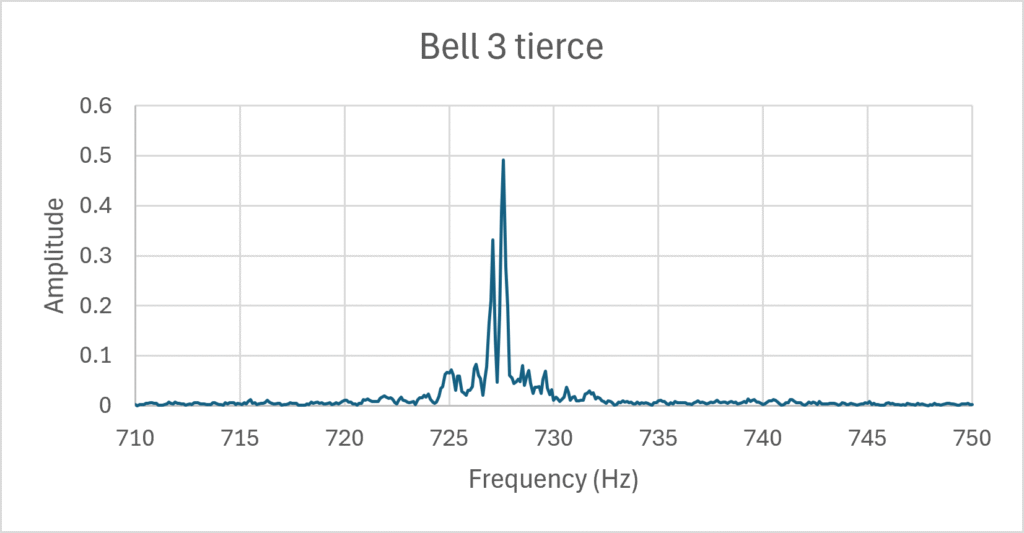
The two halves of the doublet with frequencies 727.1Hz and 727.6Hz can be seen. What emerged during the analysis of the recordings for this experiment is that, although the bells were chimed in an identical way for all the measurements, different halves of the doublets dominated in different recordings. Each set of frequency measurements was checked to make sure that the same half of the doublet for each partial was used in every case.
The higher frequency partials were not so easy to deal with. Here is the spectrum of the superquint of the same bell:
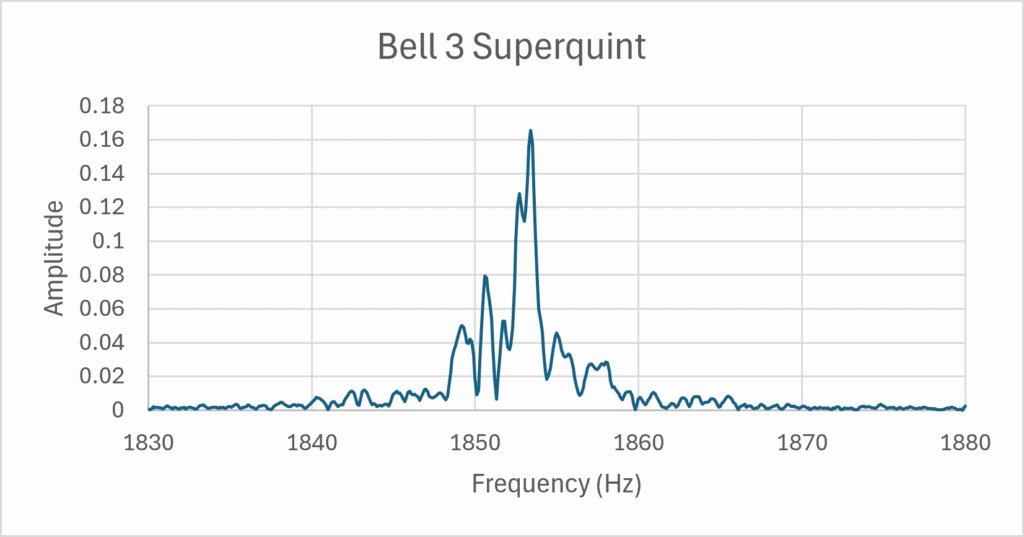
This partial has a much more complex structure. In different recordings, different peaks dominate, and great care had to be taken in selecting which frequency to take. Sometimes a frequency which was strong in one recording would be very weak, but still present, in another.
The classic theoretical analysis of doublets given by Bob Perrin and Tom Charnley in their paper Group Theory and the Bell (ref 2) does not provide an explanation for the complex structure. I have always assumed in previous analysis that this complex structure is an artifact of the fourier analysis at fine scale. However, it is clear from the many recordings of the same bells taken for this study that the same partial structure is present in every recording, but with different strengths for the various frequencies.
Bell tuners tell me that they can have difficulty measing the nominals of bells because different frequencies are observed when striking the bell at the same place on the soundbow but at different heights above the rim. This may be due to the same cause, and more investigation is needed.
Acknowledgements
I am grateful to St Martin’s Church, Dorking for allowing me to experiment on their bells.
References
- The effect of temperature on the pitch of a bell, Arthur Taber Jones, J. Acoust. Soc. AM 1, 382-384 (1930)
- Group theory and the bell, R. Perrin and T. Charnley, Journal of Sound and Vibration, Vol. 31, 411-418 (1973)