This page explains how to do tonal analysis of a bell or bells using Wavanal. Analysis of recordings is possible using any spectrum analysis package (including the spectrum analyser included in Audacity) but Wavanal has facilities specially optimised for investigating bell sounds.
If starting with a recording of multiple bells, for example all the bells in a ringing peal, at one time I would have split the recording into separate files with a sound editor. I no longer do this, I find it quicker to select each bell in the recording and analyse the selection.
Once you have downloaded Wavanal using the instructions here, run the program and the following screen should appear:
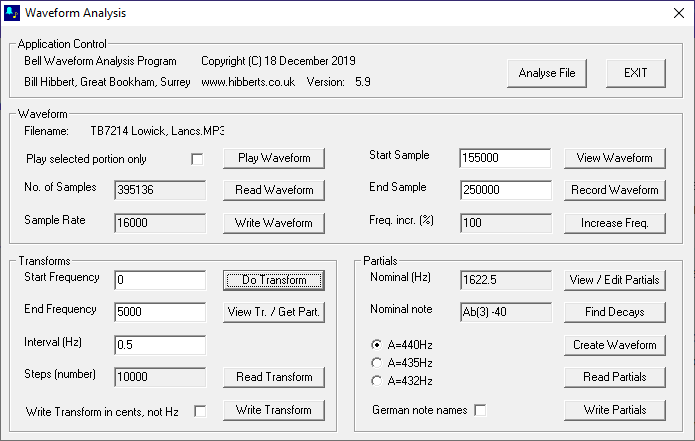
Using the Read Waveform button, open the sound file you wish to analyse. Wav and MP3 files are supported. Click the View Waveform button to open the sound file to allow a portion to be selected. Use the Scale button and the slider under the waveform display to find the bell to be analysed. Then select the desired part of the recording by clicking and dragging on the waveform display. The selection should start with the start of the bell sound and be as long as possible, but not include the next bell sound if there is one:
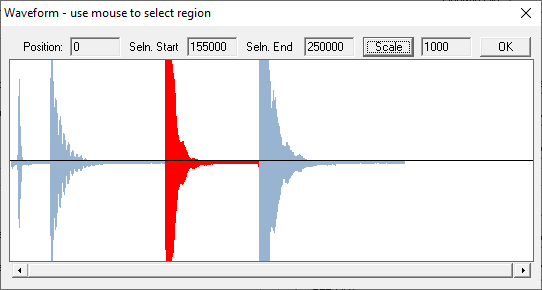
If you need to confirm you have the right bell, after exiting the View Waveform screen, click the ‘Play selected portion only’ checkbox and then click Play Waveform.
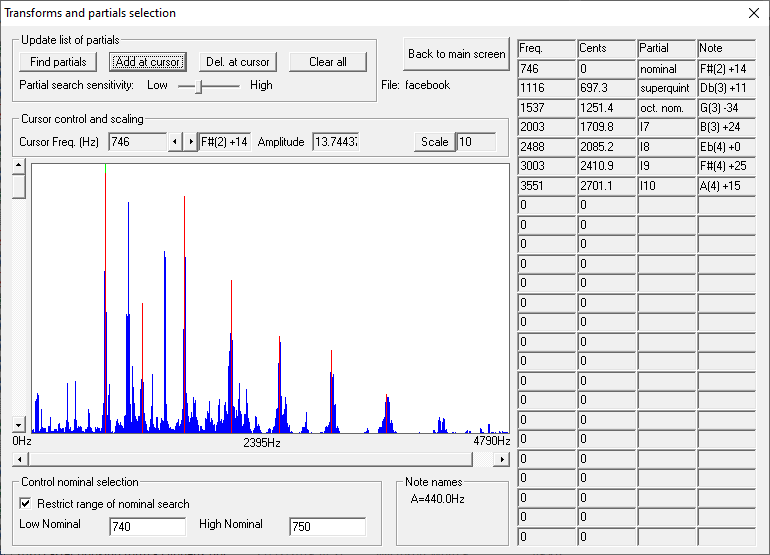
To analyse the selected portion of the recording, leave the parameters for Start Frequency, End Frequency and Interval at their default values and click Do Transform. After a short delay the following screen should appear:
If the recording is not noisy, click the Find Partials button and the main partials should be identified (highlighted in red) and their frequencies and intervals displayed on the right:
If the main partials are not found successfully, then click Clear all to get rid of any partials that have been highlighted, and then select partials individually by clicking on them on the graphical display, they will be highlighted in green. Then click Add at cursor to select each one as they are highlighted. Start at the lowest frequency and work up. (Because I am familiar with the locations of the main partials, I tend not to use the Find partial button, I select them individually in every case.)
To look more closely at individual partials, use the Scale button and the slider below the graphical display to change the horizontal scale, and the slider at the left to expand the vehicle scale:
If the main partials are still not identified, it is likely that the intervals between them are unusual, one of the partials is too quiet to be seen, or there is so much noise in the recording that too many frequencies are identified as partials. In these circumstances a procedure I use is to estimate the strike note by listening to the bell and comparing with a piano or other instrument, or using pitcher. This frequency should be doubled to get the candidate nominal frequency. I then look at the spectrum of the bell and identify the evenly spaced rim partials above the nominal. The suspected nominal and the rim partials are highlighted in the following plot:
Even if the partials below the nominal (hum, prime and tierce) are ambiguous or lost in noise, this often allows the nominal to be measured from a poor recording. The choice of the nominal and rim partials can be confirmed by selecting the checkbox Restrict range of nominal search, entering a band around the candidate nominal frequency in Low Nominal and High Nominal, and selecting and adding the partials to make the software attempt to name them. It is the act of selecting a partial frequency that causes the partials to be named, based on the selected nominal range.
If you still having trouble, then why not contact me for help?